Hello Michael
Let me answer your last question first:
The thresholds can be defined either as number of packets, bytes, or even milliseconds, all three of which can define the “fullness” of a queue. But keep in mind that queues will only exist when there is congestion. If there is no congestion, there is no queue, and there are actually no active QoS mechanisms. If there’s no congestion, every single packet that arrives at the interface is served immediately. So, the thresholds define the average number of packets (bytes/milliseconds) in the queue, a value which will be greater than zero only when there is congestion.
To be more precise, the MPD is the maximum percentage of packets that will be dropped as the average queue depth approaches the maximum threshold.
Remember that the discard probability is a function of the current average depth of the queue:
- For values between 0 and the minimum threshold, discard probability is zero
- For values between minimum and maximum threshold, the discard probability ranges linearly between 0% and the MPD value.
- For values above the maximum threshold, discard probability is 100%
So a discard probability of MPD is approached as the average queue depth approaches the maximum threshold.
One of the things that confused me initially was my interpretation of graphs like this:
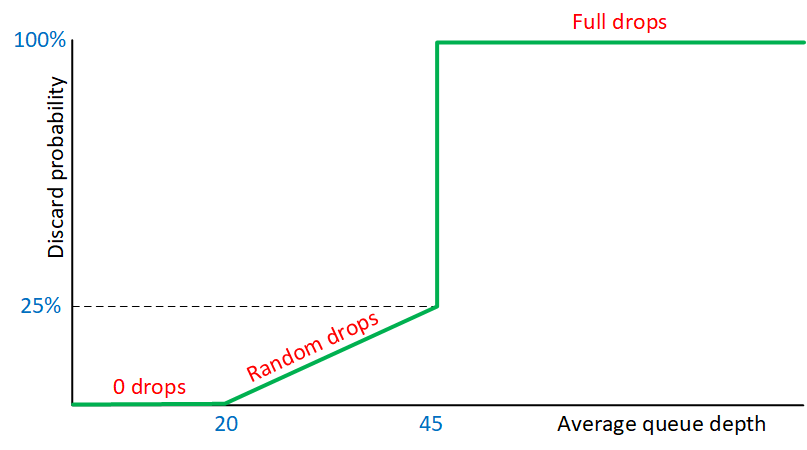
We are so used to interpreting the X axis as time, so for me it was strange that the discard probability stays at 100% to infinity. But remember, that over time, the average queue depth continually changes, up and down, so over time, you continually go back and forth on the curve (the green line) in the graph.
So you can see how the discard probability changes over time, as the average queue depth changes. The thresholds and the MPD are simply parameters that are used to define the graph, and ultimately the behaviour of the mechanism.
I hope this has been helpful!
Laz