This topic is to discuss the following lesson:
Good morning Everyone,
I couldn’t find a similar one to the topic I am starting so I apologize if a repetition occur.
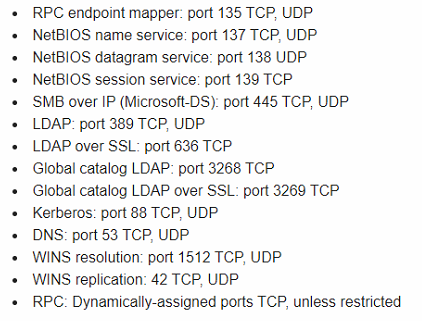
I am trying to join an MS Win 10 from my DMZ to an AD- server (MS Server 2016) into my LAN.
I did a research, and the port listed into the attachment are the ones that supposed to be opened but I think, I am missing something because I am still not able to join the domain. I also opened port 53 tcp/udp.
Can you, please give a hand with this issue ?
Best,
Asen
Hello Asen
It’s great that you mention this at this time because Rene has just completed a lesson that will help you identify specific packet drop events on an ASA. Take a look at this lesson and see if it helps you in your troubleshooting process.
Take a look and let us know how you get along.
I hope this has been helpful!
Laz
Hi,
logging buffered debugging ,I Want to send to the syslog server .
In that case what type of logging I should chose .
Why did you exclude 111008|111009|111010|302010
Thanks
Hello Sims
The type of logging you choose depends on the detail that you want included. There are eight levels of severity:
- Emergency
- Alert
- Critical
- Error
- Warning
- Notice
- Informational
- Debug
By choosing the severity, you choose what kind of events you want to be logged regardless of whether you are using a syslog server or not. You can find out more information about these levels of severity and how to connect a syslog server at the following lesson:
The specific numbers were used simply to demonstrate how you can use the exclude keyword to exclude information from the output. There is no reason to choose those particular numbers. It was done for demonstration purposes only.
I hope this has been helpful!
Laz
Hi Rene,
Can we have two more details explanation on
- ASA FLAGs
- detailing on each phase of “packet-tracer input inside sourceip sourceport destinationip destinationport”
Thanks in Advance
Manami
Hello Manami
The flags indicated in the show conn detail command output simply indicate additional information about the connection. Specifically, Cisco states that:
When you use the detail option, the system displays information about the translation type and interface information using the connection flags…
You can find more information about this command including a table that shows what each flag means in detail at the following ASA command reference link:
Each phase that is displayed within the output corresponds to a particular operation that the ASA performs on that packet. Remember that a packet coming into one ASA interface and exiting another will go through flow and route lookups, multiple ACL matches, protocol inspection and NAT. For each of these, and in the order they are applied, the output displays a “phase”.
You can find out more about this command, the various options, and details about its output at the following link:
I hope this has been helpful!
Laz
Yes Laz, this clear my doubt and is helpful too.
Thanks
manami
1 Like
Good Morning,
This is a really useful summary. I’ve worked on many projects where a Customer has ASA and it always seems to take a while to find out what the ASA is doing when connectivity isn’t working and I can see why now when it looks like everything has to be done via the CLI - in Production firewalls, the SYSLOG message quantities must be huge on a firewall in front of a Data Centre.
Can anything be done via the ASDM to get a visual view of what’s happening to make troubleshooting quicker or are you aware of 3rd Party Apps that can do this better than the CLI ?
Many thanks,
Matt
Hello Matt
Yes, there are some graphical tools that can be used that will help you in troubleshooting the ASA. Some noteworthy ones include the packet capture wizard utility in ASDM. More about this can be found at the following link.
As with all other Cisco devices, you can also set up an external syslog server that will sort through and parse your syslog messages so that you can see them more clearly, and you can filter out the unwanted information. More on this can be found here:
Beyond these, CLI tools such as ASA packet tracer using crafted packets are found (as far as I know) only within the CLI itself. If anyone knows of any other tools that may be useful, please feel free to post them in the forum.
I hope this has been helpful!
Laz
Hello,
could you explain me “Cisco ASA Order of Operation 8.3 and after”, from inside to outside, and from outside to inside. Assume that NAT, ACL on outside interface, ‘in’ direction are configured. Maybe packet-tracer can help with explanation.
I found this link: https://www.tunnelsup.com/cisco-asa-order-of-operation/
This link is also very useful:
https://resources.intenseschool.com/cisco-asa-packet-flow-part-1/
When ASA performs route-lookup? At the beginning or when packet come on egress interface?
ACL is check before NAT?
Thanks,
Marina
Hello Marina
The documents you shared describe the order of operations in detail. In addition, the following lesson also includes some information as far as ACLs are concerned:
So when does ASA perform a route lookup? According to this process, it takes place after the NAT translation.
I hope this has been helpful!
Laz