This topic is to discuss the following lesson:
Hi Rene,
Good stuff as always.
I have a questions regarding Probe keyword. How router calculating 3 rtt. Could you Pls make it clear once again.Thx
Br/Zaman
Hello Mohammad
The probe keyword in Cisco IOS just tells the router how many packets to send. A probe is essentially one ICMP packet. The router responds with three lines as shown below:
R1#traceroute 192.168.3.1 probe 1
Type escape sequence to abort.
Tracing the route to 192.168.3.1
VRF info: (vrf in name/id, vrf out name/id)
  1 192.168.12.2 0 msec
  2 192.168.23.3 4 msec
  3 192.168.3.1 0 msec
There are three lines because traceroute provides a response from each router that is traversed.
I hope this has been helpful!
Laz
2 Likes
Hi Laz ,
Still I am confused regarding Probe 1 Keyword that from the capture we saw sender sending 3 ICMP request packet (for Windows) while we used probe 1 keyword .So what is the meaning your sentence “The probe keyword in Cisco IOS just tells the router how many packets to send” . Actually I want to know how the 3 rtt value coming …
- 1 ms 1 ms <1 ms 192.168.1.254
The number of probes is the number of packets that is sent per hop. If you see 3x RTT, it means 3 probes were sent to each router. These wireshark captures might help:
In the linux capture, only 1 probe is sent to each router. The windows capture has 3 probes for each router.
2 Likes
Thanks Rene and that’s why We like you badly ![]()
Hi Rene,
We seen that windows, Cisco Router and linux will use ICMP and UDP packets during Traceroute . My question is which operation system will use TCP ? Thanks
br//zaman
Hello Mohammad
Linux uses UDP by default but you can use TCP. Check the Linux man pages to find the syntax for that. Some additional Linux traceroute implementations use TCP packets, such as tcptraceroute and layer four traceroute.
I hope this has been helpful!
Laz
1 Like
Hi team,
Can you please explain why we send incremental port number (dst port ) in the UDP traceroute ?
thanks,
Amit
Hello Amit
A traceroute on a Cisco device sends incremental destination port numbers for each hop in order to distinguish between the probes. To quote Cisco exactly:
Cisco routers send UDP probe packets with a random source port and an incremental destination port (to distinguish the different probes).
You can find more information here.
I hope this has been helpful!
Laz
1 Like
Hi Rene/Team ,
Thank you for this content !!
I understood that in windows when the destination reached it and Destination network is matched ICMP Echo Reply is used , and intermediate routers will be dropping packets because these are not destination network in our IP Header and TTL is became 0 .
Note : applications use transport layer ports for process to process delivery .
My doubt is as below :
- what exactly happening linux in transport layer while we use higher UDP port numbers . In Linux too the intermediate routers were sending ICMP TTL Expiry in response to IP packets with Incremental TTL and UDP with higher port numbers were used .
In Given Capture 1st UDP probe packet destination port is 33434 —>packet dropped as router has to decrement TTL from 1 to 0 and its not the destination network , so UDP encapsulation not even checked packet dropped with error sent to source . (please correct me if i am wrong here)
The Final UDP probe is making upto destination network with TTL = 4, so the it will check the destination port 33437 , in Response Destination port Unreachable was sent to the source .
Here “Destination port Unreachable” error what does exactly mean ? Why it this error generated and how it differs when we use a destination port number like 179(BGP) ?
From provided cloudshark capture link :
Regards,
Sameer.
Hello Sameer.
Looking over the cloudshark capture, it simply looks like the UDP port 33437 at the destination device of 192.168.3.1 is just not listening. You get a Type 3 Code 3 result which means, according to RFC 792, that the UDP port is blocked, possibly by a firewall.
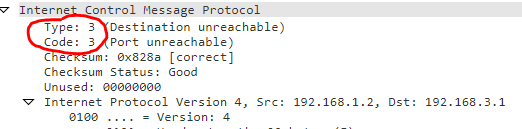
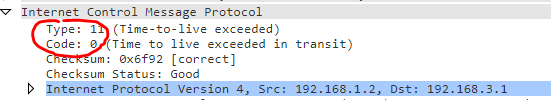
This drop of the packet is different than the drop of the packet that occurs due to TTL going to 0. In such a case, you have different Type and Code numbers such as is the case when the TTL became 0 when the device 192.168.23.3 was reached in the previous packet:
In any case, the reason why this error is generated is because the port is blocked. The device has been reached successfully, since it is responding, but the specific port is unavailable and thus the response is an error message and not an echo reply.
I hope this has been helpful!
Laz
1 Like
Several times when I do a Traceroute over de Internet sometimes I have the some hops with none reply listing the 3 probes with a asterisk * * * but if a ping the host im doing that Traceroute the ping I have a echo reply OK from this destination host…
for example pinging a 11.11.11.11 it replies ok but the Traceroute “dies” at a certain hop listing the 3 probes * * *
what does it mean ? can it be that this specific hop hasn’t the reverse route to the source address from which im doing the Traceroute ?
Hello Juan
Routers can be configured in such a way so that they don’t respond to ICMP messages. This is done for security purposes. When you see three * in one entry of the traceroute, but the traceroute completes successfully to the destination, it just means that, that specific hop in the path is configured not to respond to ICMP messages. If all subsequent entries in the traceroute fail then that means that the routing has failed and the last successful hop is the one that responded.
I hope this has been helpful!
Laz
2 Likes
Thank you for the reply.
Yes, i saw this behavior so often, it can be in the following way :
I get a ping reply ( “!!!” on cisco IOS) but when i do a traceroute to that host i have the following :
traceroute 10.10.10.10 :
1.1.1.1 x ms y ms z ms
2.2.2.2 x ms y ms z ms
3.3.3.3 x ms y ms z ms
or may i have this :
1.1.1.1
2.2.2.2
5.5.5.5
10.10.10.10
All of this is because a security configuration to not reply or filter icmp msgs ?
I would like how to configure that on a router to replicate this in a lab.
Hello Juan
Yes that’s it. Such a configuration will protect devices from attacks such as Denial of Service (DoS) and from the “ping of death”. This has to do with the implementation of control plane policing (CoPP) on network devices. CoPP is a mechanism by which we can enable policing on traffic that is destined to our network devices themselves rather than policing traffic that goes through the router. You can find out more information about CoPP at the following lesson:
I hope this has been helpful!
Laz
2 Likes
Hi,
from the below output , does it mean it took 4 ms to reach final destination ?
1     1 ms     1 ms    <1 ms  192.168.1.254
  2     1 ms     1 ms     1 ms  192.168.12.2
  3     1 ms     1 ms     1 ms  192.168.23.3
  4     1 ms    <1 ms    <1 ms  192.168.3.1
Thanks
Hello Sims
You can view each of the responses in a traceroute as a single ping to the specific hop. With the example you stated above, lets say this was a traceroute from Host1 to Host2 in the following topology:
Host1–R1–R2–R3–Host2
The first response comes from R1, so the response time of 1 ms refers to an ICMP request from Host1 to R1. The second response comes from R2, so the response time of 1 ms refers to an ICMP request from Host1 to R2. Similarly, the third response comes from R3, so the response time of 1 ms refers to an ICMP requiest from Host1 to R3.
You can view each of the responses in a traceroute as a single ping from Host1 to each router in the path. So if you want to know how long it took to reach the final destination, just look at the response time of the final traceroute response: 1ms.
I hope this has been helpful!
Laz
2 Likes
Hi,
1 1 ms 1 ms <1 ms 192.168.1.254
2 1 ms 1 ms 1 ms 192.168.12.2
3 100 ms 100 ms 100 ms 192.168.23.3
4 1 ms <1 ms <1 ms 192.168.3.1
How about echo-reply time ?
from the above output 100 ms , can I say is the echo response +processing time by the host + echo reply
Thanks
Hello Sims
The output that we see as a result of the traceroute command shows round trip time. When traceroute is initiated, it sends three packets, and the three times you see in milliseconds are the round trip delay times of each of the three packets. They measure the time between when the original ICMP packet is sent until the response to that particular packet returns. So those times (100ms for example) is the sum of the sending transmission time, the processing time of the responder and the return transmission time.
You can find out more info about traceroute at the following Cisco documentation:
I hope this has been helpful!
Laz
2 Likes